Data Analytics and Visualization  

Transforming Raw Data into Strategic Insights for Informed Decision-Making

Talk to our Experts

Data Analytics and Visualization services are critical for businesses seeking to gather meaningful information from complex data sets by converting into actionable insights and intuitive graphical representations. Our offerings in this area encompass advanced analytics techniques and state-of-the-art visualization tools to convert raw data into clear, concise, and informative dashboards and reports. With our expertise in Data Analytics and Visualization, companies can uncover hidden opportunities and optimize.

Benefits of Using Data Analytics

Get In Touch
  • Process vast volumes of information and make informed decisions
  • Delve deeper into customer sentiment data to uncover opportunities for launching new services.
  • Actionable insights to enhance productivity and sales.
  • Comprehensive visualizations of the latest marketing trends, customer behavior, demand variations, sales, and pricing.
  • Insights derived from accurate data eliminate the need for speculative guesswork.

Speak to an expert

In your line of work, we know every minute matters.

    Data Analytics and Visualization Services

    Reports and Dashboard Development

    • Strategic dashboards catered for C-suite managers, offering a comprehensive view of KPIs across the entire company.
    • Tactical dashboards tailored for mid-level management.
    • Operational dashboards created for managers to oversee business processes, pinpoint bottlenecks, and more.
    • Analytics dashboards designed for data experts, enabling them to identify trends and build forecasts.

    Data Analytics

    • Establish ETL/Data Warehouse processes for the integration of data from various sources.
    • Develop a centralized repository, OLAP cubes, and other components.
    • Enforce data security and data quality.
    • Implement data reporting and visualization systems.

    Data Visualization Optimization

    • Performance tuning for enhancing the speed and responsiveness of data visualizations
    • Tailor services for specific tools like Tableau, Power BI, Qlik, etc.
    • Prevent cognitive overload and promote easier interpretation
    • Create dynamic and interactive dashboards

    Case Study

    Gain Insights into Our Services Industry

    Our Approach

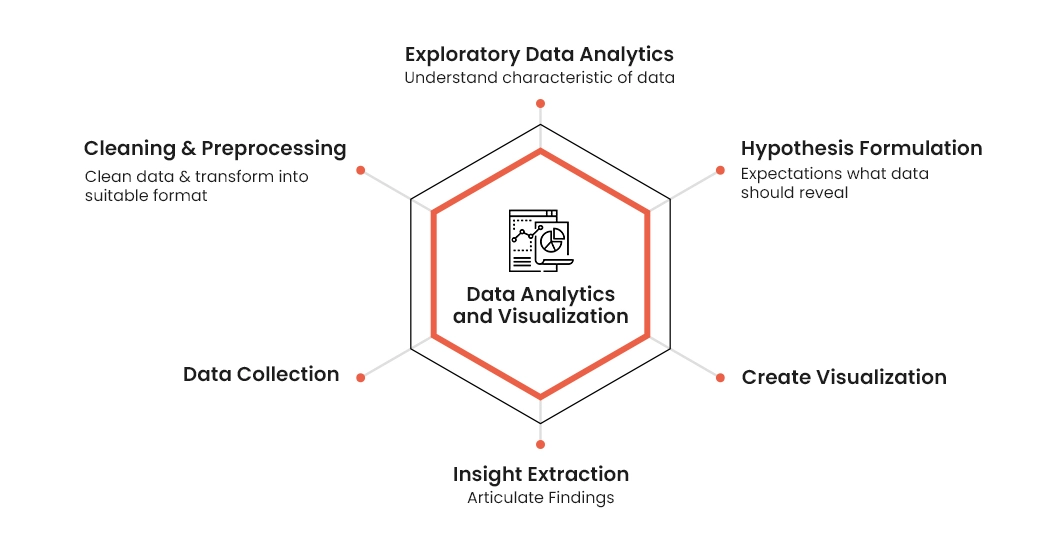
    Our approach to Data Analytics and Visualization is a comprehensive and iterative process that ensures data is not only accurately analyzed but also effectively communicated. Here’s how we approach it:

    Data-Analytics-and-visualization

    Why Choose Tx?

    Experienced data scientists & analysts across diverse industries

    Proficiency in visualization tool selection

    NLP and Conversational AI

    Track record of delivering successful data analytics projects

    Test Center of Excellence

    Cost-effective results tailored to your budget and timelines

    Recent Insights

    May 15, 2025

    BLOG

    How End-to-End Testing Supports Grid Reliability for Energy Providers

    The blog discusses how end-to-end testing helps energy providers ensure reliable service by validating system performance, data accuracy, and security. It supports smooth operations, fast outage recovery, and seamless integration of new AI and ML technologies.

    Read More

    May 13, 2025

    BLOG

    Tx-SmarTest – Unlock Smarter QA with AI-Powered Platform

    The blog discusses how Tx-SmarTest, an in-house accelerator by Tx, helps businesses enhance software quality by leveraging automation, predictive analytics, and smart integration. It simplifies QA with components like Accelerator, Analyzer, and Predictor while improving efficiency through seamless DevOps compatibility.

    Read More

    May 12, 2025

    BLOG

    Engineering Smarter Data Pipelines with Autonomous AI

    The blog discusses how AI transforms data engineering by automating tasks, streamlining pipelines, and enhancing analytics. It boosts data quality, speeds up insights, and supports smarter decision-making. By minimizing manual intervention and improving system reliability, autonomous systems empower data teams to focus on innovation while handling growing data demands in real-time, high-volume environments.

    Read More

    May 8, 2025

    BLOG

    Turn Siloed Metrics into Business-Driven Insights with Tx-Insights

    What is Tx-Insights? Why do Enterprises Struggle with CI/CD Visibility? Key Features and Functionalities of Tx-Insights Business Benefits of Leveraging Tx-Insights Summary In the current technology scenario, where almost everything is AI-integrated, quality control is becoming one of the main forces behind the success of software products. Tracking software development and testing status drastically improves Turn Siloed Metrics into Business-Driven Insights with Tx-Insights

    Read More

    May 6, 2025

    BLOG

    Tx-DevSecOps – Bridging the Gap Between Security and Speed in DevOps

    The blog discusses Tx-DevSecOps, Txs’ innovative accelerator designed to embed security seamlessly within DevOps processes. It bridges the gap between speed and security in modern DevOps environments. It also offers automated testing and compliance-ready pipelines, enabling teams to release secure, high-quality software quickly and confidently.

    Read More